INDOOR AIR QUALITY · PARTICLE MONITORING
PM2.5 vs. particle count: Why tiny particles deserve a closer look.
The same particle mass can hide very different particle counts. See why measuring both gives your building team a clearer picture of the air.
See the difference
Your PM2.5 reading is useful. But does it tell you how many particles are in the air?
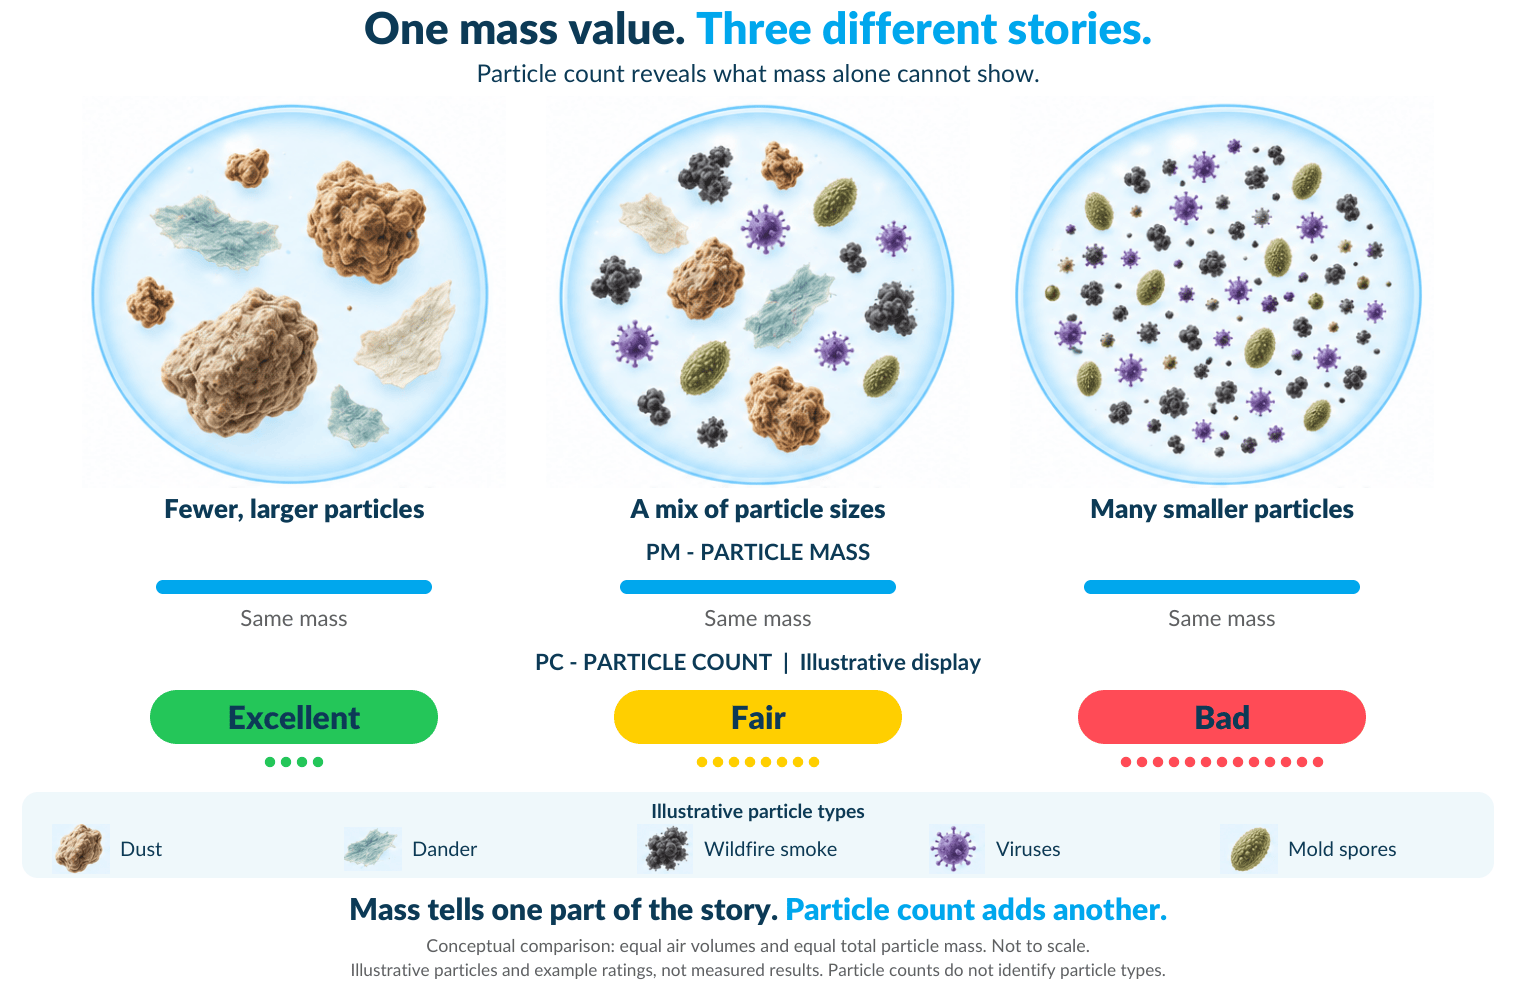
Imagine two rooms with the same particle mass. One contains fewer, larger particles. The other contains many more small particles. Their mass readings can match, even though their particle counts are very different.
That is the reason to look at PM2.5 and particle count together. For the people managing a school, workplace or building portfolio, the two measurements answer different questions—and help make the next investigation more informed.
PM2.5 vs. particle count: two questions, one clearer picture.
PM2.5 describes mass concentration: the mass of fine particles in a volume of air, typically reported in micrograms per cubic meter (µg/m³). The “2.5” refers to particles with an aerodynamic diameter of about 2.5 micrometers or smaller.
Particle count describes number concentration: how many particles are present in a volume of air. When a monitor also reports size channels, you can explore how those counts vary across its measured sizes.
| Measurement | The question it answers |
|---|---|
| PM · Particle mass | How much particle mass is in this volume of air? |
| PC · Particle count | How many particles are in this volume of air? |
Neither question replaces the other. PM2.5 is an important air-quality measure. Particle count adds detail that a mass reading alone cannot provide.
Why particles below 0.3 microns deserve attention.
A small particle has very little mass. As particle diameter decreases, that mass drops quickly. As a result, a large number of tiny particles can contribute relatively little to the total mass in the air.
ONE SIMPLE WAY TO SEE IT
Same total mass. Very different particle count.
For spherical particles of equal density. This is a size comparison, not a measured room result.The smaller particles in this example also have 10 times the combined surface area. That is one reason researchers look beyond mass when studying particle exposure. Surface area, composition and dose all matter; particle number alone does not determine the health impact.
Size changes how particles interact with the body.
Small airborne particles can reach deep into the lungs. Research on particle pollution also examines pathways involving inflammation, the nervous system and movement of some particle material into the bloodstream. The EPA explains these pathways in its review of cardiovascular effects.
For building teams, the practical takeaway is straightforward: understand the air people are breathing with more than a single number. Pair particle measurements with the room’s activities, ventilation and other air-quality data.
“Below 0.3 microns” and “ultrafine” are different ranges.
A micrometer, or micron, is one-millionth of a meter. Ultrafine particles are commonly defined as particles at or below 0.1 µm (100 nanometers). The 0.1–0.3 µm range is part of the broader submicron range.
This distinction matters when choosing a monitor. A channel starting around 0.1 µm does not cover the full range below that size. The WHO’s guidance on ultrafine particles supports measuring particle number, while calling for a much smaller lower detection limit for ambient ultrafine monitoring.
What can particle count help you investigate?
Combustion sources, including traffic, cooking and wildfire smoke, can produce small airborne particles. Inside a building, counts can change as outdoor air enters, activities take place or equipment operates. The useful question is what changed—and when.
When outdoor conditions change
Review indoor trends alongside outdoor conditions and building operation. For example, a rise during a smoke event gives your team a reason to investigate air entry, filtration and room conditions.
When a room’s activity changes
Compare patterns before, during and after an activity such as cooking. Then use the timeline to guide a closer look at the source and local exhaust.
After a building adjustment
Compare similar periods before and after maintenance or a filtration change. Keep occupancy, outdoor air and operating conditions in mind when interpreting the difference.
These patterns help direct an investigation. Identifying the source still requires context; identifying a specific organism requires a different kind of test.
Bring mass, count and context together with Flair.
Flair IAQ provides particle mass and particle count channels from 0.1 to 10 µm. Its PC0.1 channel reaches approximately 0.1 µm, adding a view of small submicron particles alongside mass measurements.
From there, Airlytics® helps your team review readings, follow trends and compare conditions. The value is a connected view: what changed, where it happened and what deserves a closer look.
- Establish your baseline.Learn what is typical for each space during normal operations.
- Follow the pattern.Review particle mass and count together, alongside other conditions and room activity.
- Review what changed.Use comparable periods to assess the readings after your team takes action.
Before choosing a monitoring plan, ask about particle-size coverage, count units, reporting tools and ongoing support. Those details determine how useful the information will be for your team.
CLEAN AIR AS A SERVICE
See more in your air.
Plan what comes next.
Explore ThinkLite’s CLAAS model with a team that understands your building’s questions. Start with your spaces, your current monitoring and what you want to improve.
Speak with a ThinkLite expertLet’s talk about your building.
- Which rooms or sites need better visibility?
- Are you reviewing mass, count or both?
- What reports and support would help your team?
We’ll discuss how CLAAS could fit your needs and confirm the scope for your project.
A FEW USEFUL ANSWERS
Particle monitoring, explained.
Does PM2.5 include particles smaller than 0.3 µm?
Yes. PM2.5 is a size-defined mass measure that includes smaller particles within its range. However, very small particles contribute little mass individually. Particle count adds a number-based view; a particular instrument’s lower detection limit also matters.
Is a higher particle count always worse?
Count is one part of the picture. Size, composition, concentration and exposure time also matter. Compare the same channels and units, and interpret changes alongside other measurements and room conditions.
How do I compare particle count readings?
Start with matching size channels, units and time periods. A count per cubic foot is different from a count per cubic centimeter. Also check whether channels describe separate size bands or cumulative counts before comparing devices.
How can I learn about CLAAS for my building?
Contact a ThinkLite expert to discuss your spaces, monitoring goals and support needs. The conversation will help define the right scope for your project.
Sources & further reading
- U.S. EPA: Particulate Matter (PM) Basics — PM definitions and health context.
- U.S. EPA: Particle Pollution and Cardiovascular Effects — potential biological pathways.
- WHO Global Air Quality Guidelines, Box 4.2 — good-practice statements on ultrafine particle monitoring.
- ThinkLite Flair IAQ — current particle channels and CLAAS overview.