Protect uptime.
Particles and corrosive gases can foul cooling surfaces and corrode components. Continuous monitoring shows when conditions change, so your team can respond early.


Track data center air quality: particles, selected gases, temperature and humidity. Guide filtration, identify energy-saving opportunities and keep an operating record.
For equipment rooms, support spaces and the people who run them.

AIRBORNE CONTAMINATION
Outdoor pollution, generator exhaust and maintenance can change the air reaching your equipment.
Flair detects changing conditions in real time. When configured triggers are met, automations activate targeted filtration, such as ICON Boost, and keep your team informed. Airlytics records every event.
Plan your monitoring programThe video could not be loaded. Open the video directly.
Use data center air quality readings and a clear response plan to guide contamination control.
Particles and corrosive gases can foul cooling surfaces and corrode components. Continuous monitoring shows when conditions change, so your team can respond early.
Equipment manufacturers specify operating environments. Airlytics keeps a time-stamped history you can share with operations, auditors and equipment vendors.
Surface cleaning removes settled dust, while monitoring shows where airborne particles keep coming back. Together, they help target cleaning and filtration.
Measure conditions, review the record, interpret changes and plan the response.

FLAIR IAQ
Flair measures particle counts down to approximately 0.1 µm alongside particulate mass, temperature and humidity.
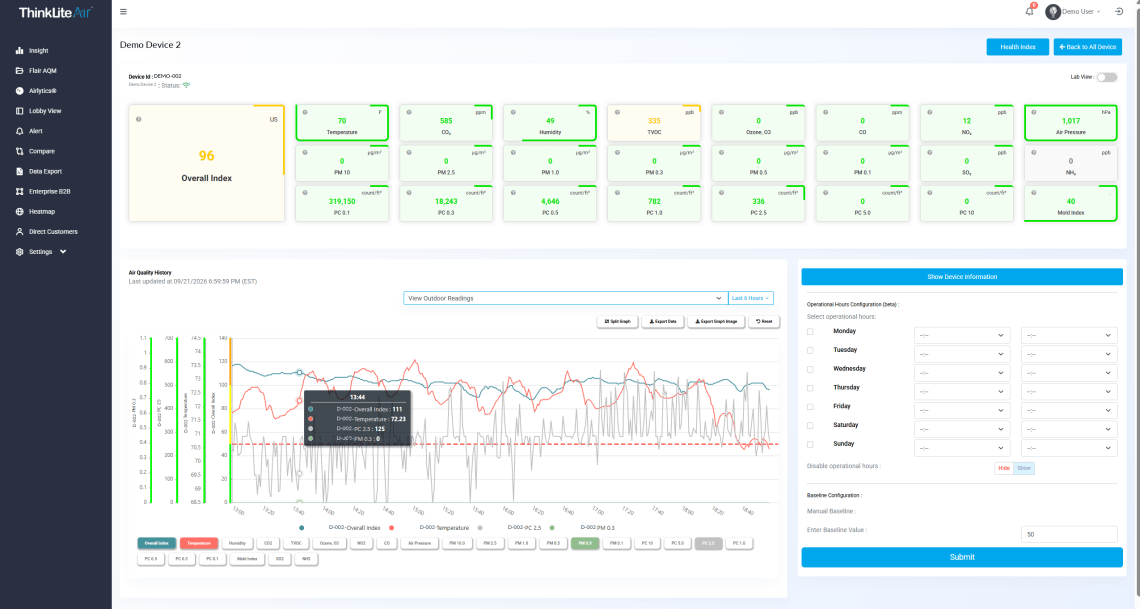
AIRLYTICS®
Airlytics brings current readings and history together. Review events by location, compare periods and share time-stamped reports for customer audits, facility reviews and operating records.

OPERATIONAL INSIGHT
Compare particle counts with selected ISO targets. For occupied support spaces, Flair’s demand-controlled ventilation (DCV) Index provides a calculated, CO₂-led demand signal.


TARGETED FILTRATION
Use room-level filtration where the layout and contamination concern call for it.
Use In-Duct Flair before and after an HVAC filter to investigate changes in the air moving through your system.

TWO UNITS. TWO MONITORING POSITIONS.
Place one In-Duct Flair before the HVAC filter and a second after it. Follow particle trends on each side to investigate filter performance.
Check the energy opportunity. Pair particle trends with HVAC filter pressure-drop and fan-power records to guide maintenance and investigate avoidable fan load.
Explore In-Duct FlairChoose room-air filtration around the layout, airflow and contamination concern. Coordinate it with central filtration and maintenance.
ICON M
ULPA filtration, a carbon pre-filter and enclosed UV treatment. Plan placement around aisle containment, service access and the designed airflow.
Boost when needed. Return to Eco. Configured rules restore lower-speed operation after recovery, creating an energy-saving opportunity compared with continuous Boost.
Explore ICON MPURILUX
Combine air purification and LED lighting in suitable control rooms, corridors and support spaces.
Explore PuriluxChoose the measurements, connections and monitoring positions that fit your equipment and operating requirements.
Flair supports local building management system (BMS) connections through BACnet and Modbus, with MQTT and API options. Your configured BMS sequence carries out the approved response.
Set operating limits from your equipment requirements. Use corrosion testing where specified.
Review connectivity optionsASHRAE’s 2011 contamination guidance recommends ISO Class 8 cleanliness, with copper corrosion below 300 Å/month and silver below 200 Å/month. These corrosion benchmarks come from coupon testing, not gas-sensor readings. Apply current thermal guidance alongside the equipment requirements and contamination assessment.
CLAAS · Clean Air as a Service
Bring equipment, software and air-engineering support into a service plan for data center air quality.
Plan your monitoring programBuild your plan around three decisions:
Choose priority zones and the measurements each needs.
Align reporting, filtration and site responsibilities.
Define equipment service and ongoing technical support.
No. Liquid cooling does not remove every air-exposed component. Power supplies, storage and network equipment may still rely on air cooling. Monitor the conditions required by your hardware and cooling design.
PM₂.₅ measures mass, while particle count measures number. Reading both helps reveal changes that a mass reading alone can understate.
It compares particle counts with selected ISO 14644-1 targets. The ISO 8 example on this page uses the 0.5, 1.0 and 5.0 µm channels in counts/ft³. ISO expresses concentrations in particles/m³, so readings and targets must use matching units. A target comparison does not replace the sampling and testing required for formal classification.
No. Coupons assess corrosion on metal surfaces. Flair tracks air conditions. Together, they provide different evidence for the investigation.
Flair supports local BMS connections and project-specific on-premises options. We define the data path, network requirements and available reporting features with your IT team.
PLAN YOUR FIRST STEP
Tell us which spaces need attention. We’ll help you define the monitoring, reporting and purification approach.
© 2026 — ThinkLite. All Right Reserved.